Costco Excel edition
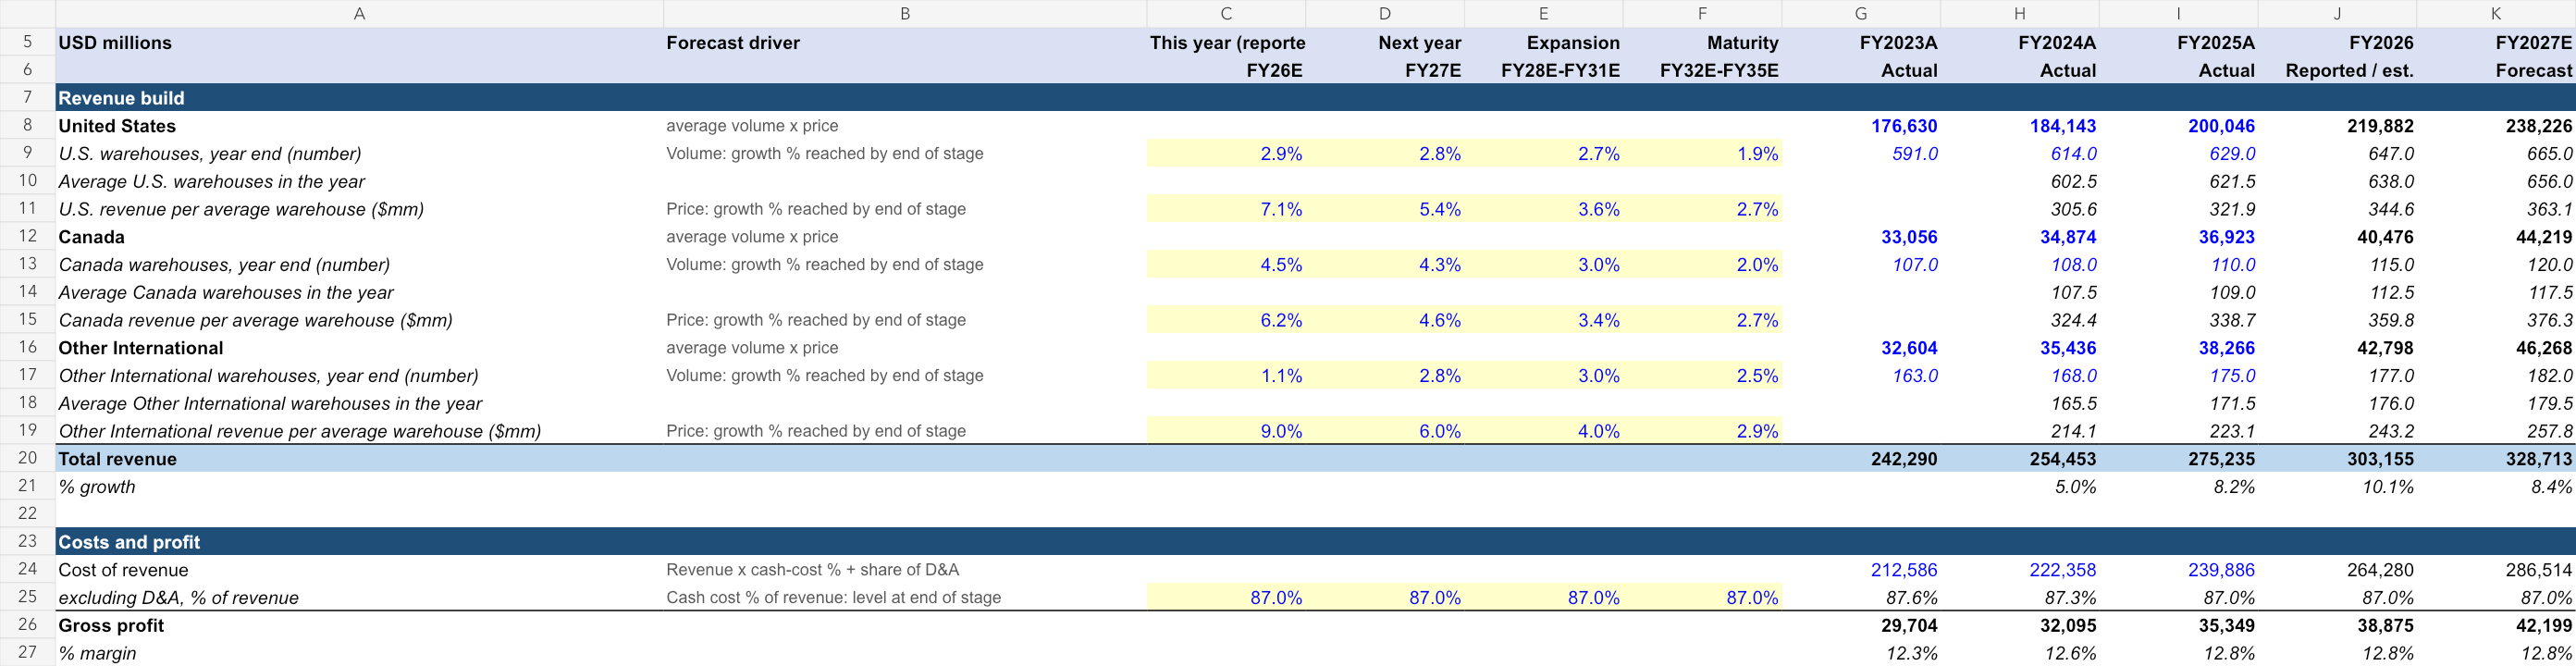
Warehouse counts and revenue per warehouse across geographic markets. Change the highlighted assumptions to explore the relationship between operating performance, cash flow and value.
Inside the workbook
- Income Statement, Balance Sheet, Cash Flow and DCF Valuation worksheets.
- Three historical fiscal years and ten modeled periods with source and forecast notes.
- Discounted cash flows, terminal-value methods and valuation sensitivities.
| Edition detail | Included |
|---|---|
| Valuation date | 2 October 2026 |
| Historical periods | FY2023A, FY2024A, FY2025A |
| Modeled periods | FY2026–FY2035E |
| Financial currency | USD in millions |
| Format | Editable .xlsx · Four worksheets · 48.4 KB |
| Price | US$19.99 for 12 months of company-model access |
Historical figures recorded in this edition
These are cached historical entries in the uploaded Costco workbook, dated 2 October 2026. Fiscal-year labels and units follow the file; they are not live data. The source annotations below are the model author’s references, rather than an independent audit of every figure.
| Metric | FY2023A | FY2024A | FY2025A |
|---|---|---|---|
| Total revenue | 242,290.00 | 254,453.00 | 275,235.00 |
| Operating income (EBIT) | 8,114.00 | 9,285.00 | 10,383.00 |
| Net income | 6,292.00 | 7,367.00 | 8,099.00 |
How this edition builds the forecast
Warehouse counts and revenue per warehouse across geographic markets. The first forecast period is FY2026. The editable assumptions distinguish the operating driver from the reasoning used to forecast it.
U.S. warehouses, year end (number)
Mechanism: Volume: growth % reached by end of stage
Inputs shown in this file: FY26E: 2.9% · FY27E: 2.8% · FY28E-FY31E: 2.7% · FY32E-FY35E: 1.9%
Read this driver’s forecast rationale
U.S. warehouses were 591 / 614 / 629 at the FY23-FY25 year ends (SEC Form 10-K for fiscal 2023 (53 weeks ended 2023-09-03), filed 2023-10-11; SEC Form 10-K for fiscal 2024 (52 weeks ended 2024-09-01), filed 2024-10-09; SEC Form 10-K for fiscal 2025 (52 weeks ended 2025-08-31), filed 2025-10-08, Item 2), 647 at FY26 end (+18, +2.86%) and are planned at 665 at FY27 end (+18, +2.78%) (Q4 fiscal 2026 supplemental information (Form 8-K Exhibit 99.2, 2026-09-24), Warehouse Expansion). Management targets a run rate of 30 net new warehouses a year company-wide (Q4 fiscal 2026 earnings call of 2026-09-24 (transcript in The Globe and Mail, 29-Sep-2026; MarketBeat call highlights, 24-Sep-2026)). FY26 and FY27 values reproduce those counts. Assumption: growth eases to 2.7% by FY31 (about 20 a year, two-thirds of the 30 target and the U.S. share of FY25-FY27 openings) and to 1.9% by FY35 (about 15 a year) as desirable sites get harder to secure (SEC Form 10-K for fiscal 2025 (52 weeks ended 2025-08-31), filed 2025-10-08, MD&A).
Read the workbook’s historical source annotation
SEC Form 10-K for fiscal 2023 (53 weeks ended 2023-09-03), filed 2023-10-11, SEC Form 10-K for fiscal 2024 (52 weeks ended 2024-09-01), filed 2024-10-09 and SEC Form 10-K for fiscal 2025 (52 weeks ended 2025-08-31), filed 2025-10-08, Item 2 - Properties: warehouses in the United States and Puerto Rico at year end
U.S. revenue per average warehouse ($mm)
Mechanism: Price: growth % reached by end of stage
Inputs shown in this file: FY26E: 7.1% · FY27E: 5.4% · FY28E-FY31E: 3.6% · FY32E-FY35E: 2.7%
Read this driver’s forecast rationale
U.S. revenue per average warehouse was $305.6mm in FY24 and $321.9mm in FY25 (+5.3%). U.S. comparable sales were +6% in FY25 (+7% excluding gas and FX; SEC Form 10-K for fiscal 2025 (52 weeks ended 2025-08-31), filed 2025-10-08, MD&A) and +8.2% in FY26 (+6.6% adjusted), with Q4 FY26 traffic +3.2% and ticket +7.3% (Q4 and fiscal 2026 earnings release (Form 8-K Exhibit 99.1, 2026-09-24; unaudited, subject to reclassification); Q4 fiscal 2026 supplemental information (Form 8-K Exhibit 99.2, 2026-09-24)). FY26 segment revenue is not yet filed: the release gives total revenue ($303,154mm) and the 10-Q gives 36-week U.S. revenue of $149,934mm, +8.8% (SEC Form 10-Q for the quarter ended 2026-05-10, filed 2026-06-03, Note 9). Assumption for FY26: Q4 U.S. revenue grew by its Q4 comparable sales (+10.7%, Q4 and fiscal 2026 earnings release (Form 8-K Exhibit 99.1, 2026-09-24; unaudited, subject to reclassification)) plus a 1.7pt new-warehouse and membership contribution common to all segments, the figure that reconciles the three segments to reported Q4 revenue of $95,723mm; that gives FY26 U.S. revenue of about $219.9bn and +7.1% per average warehouse. Membership fees sit in segment revenue (not split by segment; paid members 84.1mm, +3.8%; U.S./Canada renewal 92.3%; the Sept-2024 fee increase was fully lapped in Q4 FY26; Q4 fiscal 2026 supplemental information (Form 8-K Exhibit 99.2, 2026-09-24); Q4 fiscal 2026 earnings call of 2026-09-24 (transcript in The Globe and Mail, 29-Sep-2026; MarketBeat call highlights, 24-Sep-2026)). FY27: +5.4%, set with the other segments so total revenue lands on consensus ($328.5bn, +8.4% on reported FY26; FY28 consensus $352.9bn, +7.4%). Assumption after: growth fades to 3.6% by FY31 (comparable sales net of new-warehouse dilution) and 2.7% by FY35, close to inflation.
Canada warehouses, year end (number)
Mechanism: Volume: growth % reached by end of stage
Inputs shown in this file: FY26E: 4.5% · FY27E: 4.3% · FY28E-FY31E: 3.0% · FY32E-FY35E: 2.0%
Read this driver’s forecast rationale
Canada warehouses were 107 / 108 / 110 at the FY23-FY25 year ends (SEC Form 10-K for fiscal 2023 (53 weeks ended 2023-09-03), filed 2023-10-11; SEC Form 10-K for fiscal 2024 (52 weeks ended 2024-09-01), filed 2024-10-09; SEC Form 10-K for fiscal 2025 (52 weeks ended 2025-08-31), filed 2025-10-08, Item 2), 115 at FY26 end (+5) and are planned at 120 at FY27 end (Q4 fiscal 2026 supplemental information (Form 8-K Exhibit 99.2, 2026-09-24)); five Canadian openings are planned for FY27 (Q4 fiscal 2026 earnings call of 2026-09-24 (transcript in The Globe and Mail, 29-Sep-2026; MarketBeat call highlights, 24-Sep-2026)). FY26 and FY27 values reproduce those counts. Assumption: growth eases to 3.0% by FY31 (about 4 a year) and 2.0% by FY35 (about 3 a year), a mature market growing more slowly than Other International (SEC Form 10-K for fiscal 2025 (52 weeks ended 2025-08-31), filed 2025-10-08, MD&A).
Read the workbook’s historical source annotation
SEC Form 10-K for fiscal 2023 (53 weeks ended 2023-09-03), filed 2023-10-11, SEC Form 10-K for fiscal 2024 (52 weeks ended 2024-09-01), filed 2024-10-09 and SEC Form 10-K for fiscal 2025 (52 weeks ended 2025-08-31), filed 2025-10-08, Item 2 - Properties: warehouses in Canada at year end
The later forecast years contain modeling judgments. The historical labels, financial-period dates and valuation date are separate from any stock-price observation; this page does not supply a current market quote.
One company. One year of access.
Your US$19.99 one-time purchase includes 12 months of downloads and updates for this company’s model. No automatic renewal. Downloaded files remain usable after access ends; no fixed update cadence is promised.
Read the current version’s notes
USD in millions, fiscal year ending the Sunday nearest August 31 (52/53-week year; FY2023 had 53 weeks). Base case: history is FY2023-FY2025, the latest fiscal years with a filed 10-K. FY2026E reproduces the reported, unaudited FY2026 results in the 24-Sep-2026 earnings release; FY2027E lands on analyst consensus; later years are this model's own assumptions, each explained in the last column.
Dates and descriptions reflect this workbook’s notes. They are not a claim of independent audit or a guarantee that its forecasts will occur.