TSMC Excel edition
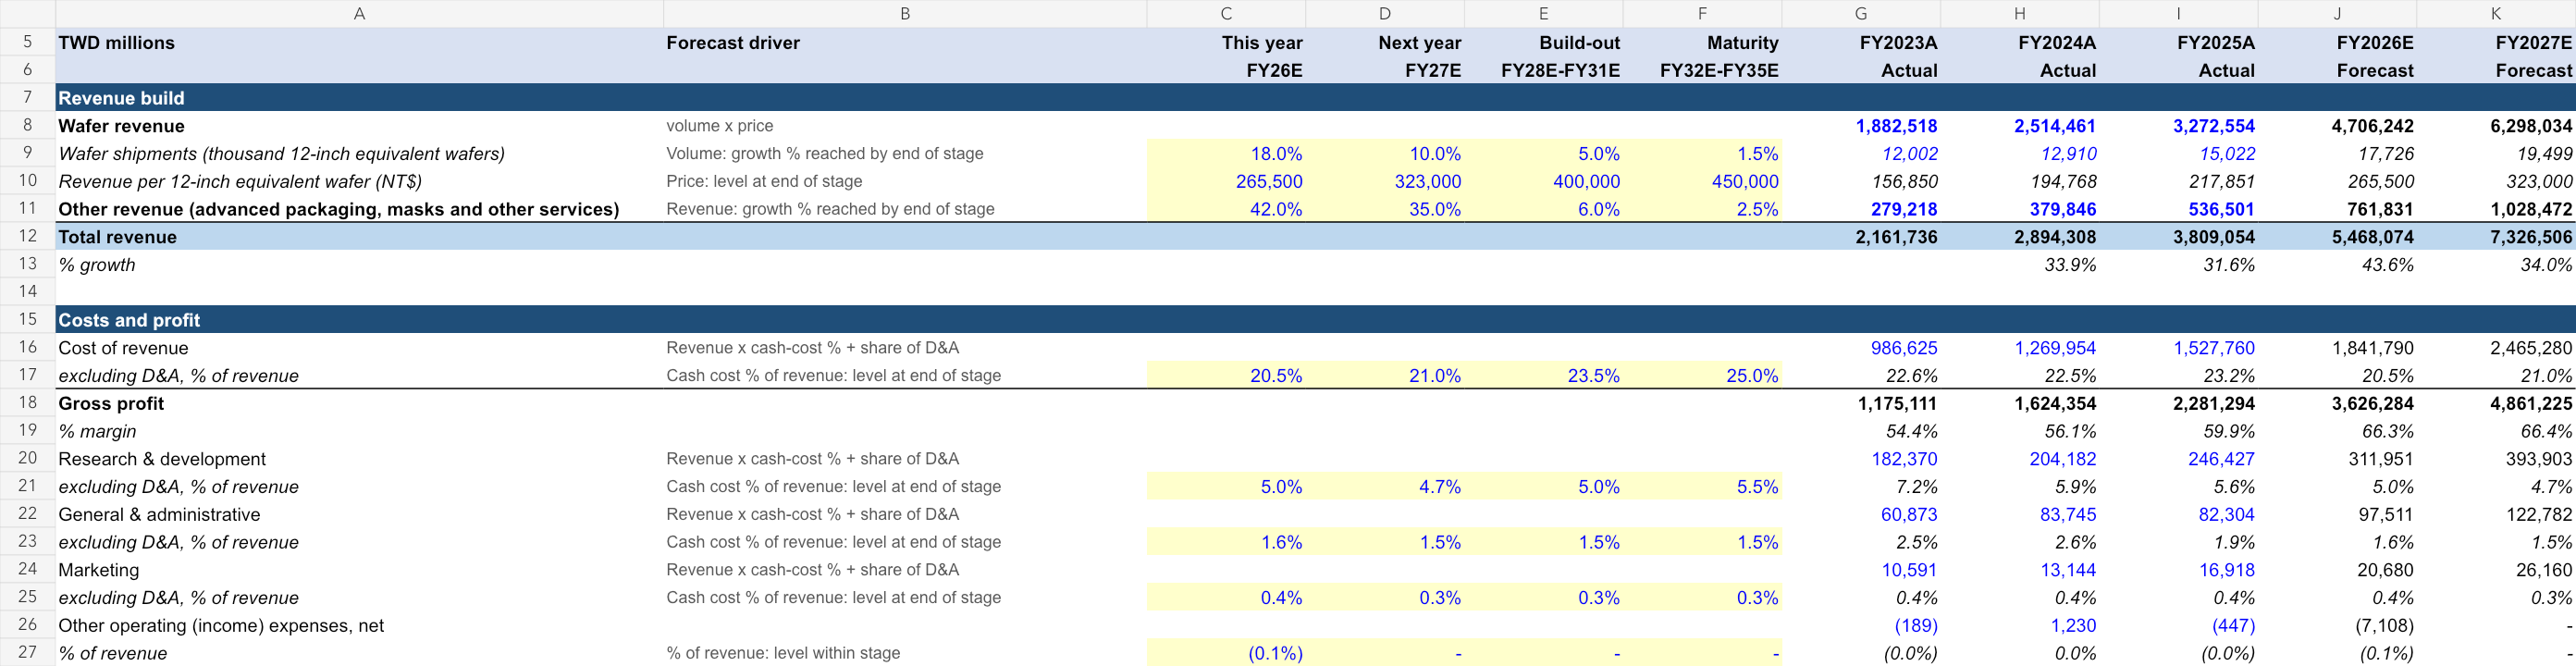
Wafer shipments, revenue per wafer and other services. Change the highlighted assumptions to explore the relationship between operating performance, cash flow and value.
Inside the workbook
- Income Statement, Balance Sheet, Cash Flow and DCF Valuation worksheets.
- Three historical fiscal years and ten modeled periods with source and forecast notes.
- Discounted cash flows, terminal-value methods and valuation sensitivities.
| Edition detail | Included |
|---|---|
| Valuation date | 2 October 2026 |
| Historical periods | FY2023A, FY2024A, FY2025A |
| Modeled periods | FY2026E–FY2035E |
| Financial currency | TWD in millions |
| Format | Editable .xlsx · Four worksheets · 49.3 KB |
| Price | US$19.99 for 12 months of company-model access |
Historical figures recorded in this edition
These are cached historical entries in the uploaded TSMC workbook, dated 2 October 2026. Fiscal-year labels and units follow the file; they are not live data. The source annotations below are the model author’s references, rather than an independent audit of every figure.
| Metric | FY2023A | FY2024A | FY2025A |
|---|---|---|---|
| Total revenue | 2,161,735.80 | 2,894,307.70 | 3,809,054.30 |
| Operating income (EBIT) | 921,465.60 | 1,322,053.00 | 1,936,091.70 |
| Net income | 851,740.00 | 1,158,380.20 | 1,697,604.00 |
How this edition builds the forecast
Wafer shipments, revenue per wafer and other services. The first forecast period is FY2026E. The editable assumptions distinguish the operating driver from the reasoning used to forecast it.
Wafer shipments (thousand 12-inch equivalent wafers)
Mechanism: Volume: growth % reached by end of stage
Inputs shown in this file: FY26E: 18.0% · FY27E: 10.0% · FY28E-FY31E: 5.0% · FY32E-FY35E: 1.5%
Read this driver’s forecast rationale
Shipments were 4,174k in 1Q26 and 4,336k in 2Q26 (12-inch equivalent), 8,510k in 1H26 against 6,977k in 1H25 (3,259k + 3,718k), up 22% (SEC Form 6-K, 2Q26 earnings release and presentation (filed 2026-07-16); SEC Form 6-K, 1Q26 earnings presentation (filed 2026-04-16); SEC Form 6-K, 4Q25 earnings presentation (filed 2026-01-15)). Annual capacity 'exceeded 17 million' 12-inch equivalent wafers in 2025 against 15.0mm shipped (SEC Form 20-F FY2025 (filed 2026-04-16), Item 4). Management said in January 2026 that 2026 capex would add little to 2026 output and only marginally to 2027, with output gains coming from productivity first (TrendForce News, 2026-01-15). Assumption: +18% in FY26 (2H up ~15% on 2H25), +10% in FY27 as new fabs are not yet in volume (Arizona fab 2 volume output is planned for 2H27), then 5-9% a year while the 13 new advanced fabs announced for Taiwan and the added Arizona fabs come on line (Taipei Times, 2026-07-17), fading to 1.5% by FY35.
Read the workbook’s historical source annotation
SEC Form 20-F FY2025 (filed 2026-04-16), Item 5 - Operating Results, table 'Wafer (12-inch equivalent) shipment' (in thousands)
Revenue per 12-inch equivalent wafer (NT$)
Mechanism: Price: level at end of stage
Inputs shown in this file: FY26E: 265,500 · FY27E: 323,000 · FY28E-FY31E: 400,000 · FY32E-FY35E: 450,000
Read this driver’s forecast rationale
Wafer revenue per wafer was NT$156.9k (FY23), NT$194.8k (FY24) and NT$217.9k (FY25, about US$7.0k at the year's weighted NT$31.11; SEC Form 20-F FY2025 (filed 2026-04-16), Item 4), and NT$231.9k in 1Q26 and NT$247.6k in 2Q26 (wafer revenue from SEC Form 6-K, 1H26 financial statements, Taiwan-IFRS (filed 2026-08-14), Note 20, divided by shipments from SEC Form 6-K, 1Q26 earnings presentation (filed 2026-04-16) and SEC Form 6-K, 2Q26 earnings release and presentation (filed 2026-07-16)), driven by mix: 3nm and 2nm reached 33% of 2Q26 wafer revenue and 7nm-and-below 77% (SEC Form 6-K, 2Q26 earnings release and presentation (filed 2026-07-16)). Revenue is mostly billed in US dollars; the 3Q26 outlook assumes US$1 = NT$32 versus NT$31.6 in 1H26 (SEC Form 6-K, 2Q26 earnings release and presentation (filed 2026-07-16)), and this model holds NT$32 thereafter, so NT$ price growth equals US$ price growth. FY26 level is set so total revenue lands on the company outlook of 'slightly above 40%' US$ growth on FY25's US$122.42bn (SEC Form 6-K, 2Q26 earnings release and presentation (filed 2026-07-16); SEC Form 6-K, 4Q25 earnings presentation (filed 2026-01-15)) - about NT$5.47tn, 0.5% above consensus NT$5.44tn - which needs ~NT$289k per wafer in 2H26 as the 3Q26 outlook (US$44.6-45.8bn, +9.5-14% q/q) is mostly price and mix. FY27 level is what consensus revenue (NT$7.33tn) implies given the volume and Others assumptions; price rises of 3-6% from January 2027 led by 2nm/3nm have been reported (DIGITIMES via BigGo Finance, 2026-09-23). Assumption: thereafter +NT$19k a year (~5-6%) to FY31 from like-for-like increases and the move to A16/A14 (A14 volume production 2028; Taipei Times, 2026-07-17), then +NT$12.5k a year (~3%). Mid-term check: with the volume row this gives FY29 revenue of NT$9.8tn, about US$307bn at NT$32, a 2024-29 US$ growth rate of ~28% a year, against management's January 2026 outlook of a rate 'approaching 25%' (SEC Form 6-K, 4Q25 earnings presentation (filed 2026-01-15)), which was set before the 2026 outlook was raised from close to 30% to slightly above 40% (SEC Form 6-K, 2Q26 earnings release and presentation (filed 2026-07-16)).
Other revenue (advanced packaging, masks and other services)
Mechanism: Revenue: growth % reached by end of stage
Inputs shown in this file: FY26E: 42.0% · FY27E: 35.0% · FY28E-FY31E: 6.0% · FY32E-FY35E: 2.5%
Read this driver’s forecast rationale
Other revenue grew 36% in FY24 and 41% in FY25 (SEC Form 20-F FY2025 (filed 2026-04-16), Note 22) and was NT$362.7bn in 1H26, up 37.6% on 1H25's NT$263.6bn; 2Q26 alone was NT$196.7bn, up 42% (SEC Form 6-K, 1H26 financial statements, Taiwan-IFRS (filed 2026-08-14), Note 20). Advanced packaging is one of the stated uses of the 2026 capital budget (10-20% of the budget; TrendForce News, 2026-01-15) and of the US$29.4bn appropriation approved in August 2026 (SEC Form 6-K, board resolutions (filed 2026-08-11)). Assumption: +42% in FY26 (2H ~+46% as packaging capacity ramps), +35% in FY27, fading to 6% by FY31 and 2.5% by FY35. Limitation: The 20-F splits revenue only into Wafer and Others. Others bundles advanced packaging (CoWoS, SoIC, InFO), mask making, design and other services, and the filings give no volumes, capacity or prices for any of them (advanced-packaging capacity figures appear only in management commentary and press reports), so no unit driver can be built.
Read the workbook’s historical source annotation
SEC Form 20-F FY2025 (filed 2026-04-16), Note 22 - Net revenue, disaggregation by product (Others)
The later forecast years contain modeling judgments. The historical labels, financial-period dates and valuation date are separate from any stock-price observation; this page does not supply a current market quote.
One company. One year of access.
Your US$19.99 one-time purchase includes 12 months of downloads and updates for this company’s model. No automatic renewal. Downloaded files remain usable after access ends; no fixed update cadence is promised.
Read the current version’s notes
TWD in millions, fiscal year ending December 31. Base case in New Taiwan dollars, valued against the Taiwan Stock Exchange listing (2330; one ADR = 5 shares). FY2026E follows reported 1H26 results, the 3Q26 outlook and the full-year outlook; FY2027E revenue lands on analyst consensus; later years are this model's own assumptions, each explained in the last column.
Dates and descriptions reflect this workbook’s notes. They are not a claim of independent audit or a guarantee that its forecasts will occur.